In the world of retail investing, Trading 212 has established itself as a powerhouse platform, offering commission-free trading and a user-friendly interface. However, for the serious income investor, there is a significant difference between seeing your current balance and truly understanding your portfolio’s performance.
To achieve financial independence, you need to treat your investments like a business. This means moving beyond the basic ‘Green or Red’ charts and diving deep into the data. In this guide, we will show you how to unlock your data from the Trading 212 mobile app and explain how our custom Dividend Dashboard turns raw numbers into actionable intelligence.
We are not licensed financial advisors and we don’t know your full circumstances (country of tax residence, other assets, withdrawal rate, health horizon, risk tolerance). This blog post is for educational and entertainment purposes only and not a personal recommendation.
How to Export Trading 212 History to CSV (Mobile App Guide)
Trading 212 stores every transaction you’ve ever made, but to analyze it properly, you need to export it into a CSV (Comma Separated Values) format. As of the latest 2024/2025 ‘New App’ interface, follow these exact steps to get your data:
- Open the App: Launch Trading 212 on your iOS or Android device.
- Access the Menu: Tap the Menu icon (three horizontal lines) or your Profile icon located in the bottom right corner of the screen.
- Navigate to History: Select the History tab. This view shows your recent trades, dividends, and interest payments.
- Find the Export Icon: Look at the top right corner of the History screen. You will see a small document icon with an arrow pointing down (the Export icon). Tap it.
- Select Your Data: You will be prompted to choose which data to include. For a full analysis, ensure Dividends, Interest, and Orders are selected.
- Set the Timeframe: For the most accurate dashboard results, select Lifetime or Maximum. This ensures the tool can calculate your long-term growth and lifetime averages.
- Generate & Download: Tap Export. The app will generate the file. You can then choose to Save to Files on your phone or email it to yourself.
Please note that currently the IBKR Income Tracking tool that we provide on moneyfinal.com, has been mainly tested with accounts that have Euro (€) as the main account currency on the Interactive Brokers account.
Once you have this file, you are ready to use our Trading 212 Income Tracker to see what your broker isn’t telling you.
Why Tracking Your Investments is Essential
Most investors fail because they only look at their “Total Return.” While seeing a portfolio up 10% is great, it doesn’t tell you the “how” or the “when.”
Tracking your investment history allows you to:
- Identify Your Real Winners: Sometimes a stock with a high price increase is actually underperforming once you factor in the lack of dividends compared to a slower-moving ‘Dividend King’.
- Monitor Yield on Cost: Seeing how your dividends grow relative to your initial investment is the ultimate motivator for long-term holding.
- Tax Preparation: Having a categorized breakdown of interest vs. dividends vs. capital gains is a lifesaver during tax season.
What Trading 212 Doesn’t Show You
The Trading 212 platform is excellent for execution, but it is not a dedicated accounting or analytics suite. Here is what is missing from the standard app that our tool provides:
- True Monthly Averages: The app shows what you earned this month, but our dashboard calculates your Monthly Dividend Average across your entire investing lifetime, helping you project when you can live off your passive income.
- Isolated Income Streams: Trading 212 often lumps “Result” together. Our tool separates Dividends, Cash Interest, Lending Interest, and Trading P/L into distinct buckets.
- Visualized Growth Trajectories: While the app shows a balance line, our dashboard provides a Dividend Growth Trajectory, showing the ‘Snowball Effect’ in action, independent of market volatility.
Exploring the Features of Trading 212 Income Tracker
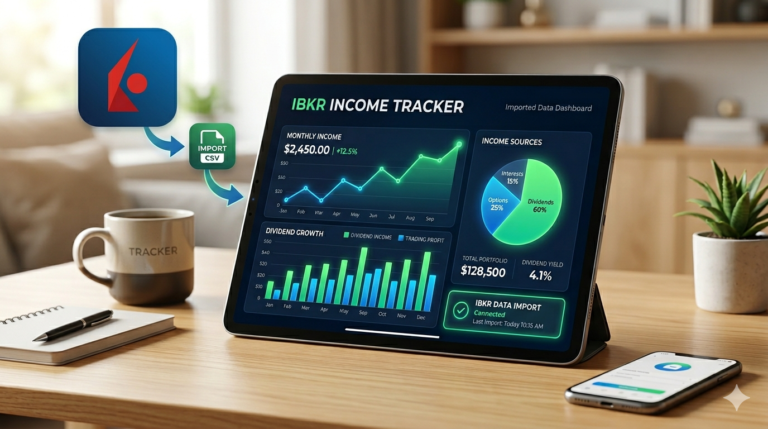
Our custom-built dashboard was designed to bridge the gap between a broker and a professional fund manager’s report. Here are the core features you can use once you upload your CSV:
1. The Big Picture Stats
At a glance, you’ll see your Absolute Total Income. This isn’t just your portfolio value; it’s the total “New Money” your portfolio has generated through dividends, interest, and successful trades. We also highlight your Lifetime Dividends, a pure metric of passive income success.
2. Intelligent Calendar History
Instead of a never-ending list of transactions, our tool groups your history into Collapsible Yearly and Monthly Sections. You can quickly see which months were your highest earners and drill down into the specific tickers that paid out during that period.
3. Ticker-Specific Intelligence
Ever wondered exactly how much ‘Apple’ or ‘Realty Income’ has paid you since you started? Our Ticker Search and Filter allows you to sort your holdings by total income. You can see which stocks are your “Income Anchors” and which ones might be lagging.
4. Advanced Data Visualization
We utilize Chart.js integration to provide:
- Asset Share Breakdown: A doughnut chart showing which tickers contribute most to your income.
- Income Stream Analysis: A bar chart comparing your dividends vs. interest vs. trading profits over time.
- Dividend Growth Trajectory: A line graph that tracks the cumulative growth of your passive income.
5. Net vs. Gross Dividends
The dashboard primarily tracks the ‘Net‘ amount that actually hits your account. For example, Realty Income is a US REIT, and if your Trading 212 account’s base currency is EUR or GBP, the platform will automatically deduct a 15% (or 30%) US Withholding Tax, (exact amount depends on the residence country you submitted in your identity information) before the funds are credited.
For example, if Realty Income paid the following amounts per share during two separate months:
- February ($0.270): Net amount is approximately $0.2295.
- March ($0.2705): Net amount is approximately $0.2299.
- Reality Check (Your Real Income Values): Because the increase is only $0.0004 per share, it is often lost in rounding when the dashboard calculates the “Dividend Per Share” (DPS) from your total received payment.
Currency Fluctuations (FX Impact)
Realty Income pays in USD, but if your Trading 212 account is in GBP or EUR, the conversion rate changes every month.
- If the Dollar weakened slightly against your local currency between February and April, the “increase” in the dividend would be completely canceled out by the exchange rate.
- The dashboard calculates DPS by dividing the converted amount you received by your share count. Even if the dividend went up in USD, it might stay the same (or even drop) in your local currency.
Precision and Rounding in the Code
Looking at the dashboard’s logic:
- The tracker calculates the DPS by taking the total dividend received and dividing it by your “Quantity” at that time.
- The HTML/JS code for the history view (seen in your file) uses standard number formatting. If the difference between $0.270$ and $0.2705$ results in a change smaller than what the chart’s scale or rounding logic displays, the line will appear flat.
Fractional Shares
If you hold fractional shares (e.g., 10.5 shares), Trading 212 rounds your payment to the nearest penny. Because the dividend increase is so small (less than 1/10th of a cent per share), you would need to own at least 20 shares for the $0.0005$ increase to even add 1 cent to your total monthly payment. If you own fewer shares, your total payout remains identical, and the graph shows 0% growth.
Summary: The dashboard is showing you the real-world cash you received.
Conclusion
The secret to successful investing isn’t just picking the right stocks; it’s understanding the data behind them. By exporting your Trading 212 history and utilizing our Trading 212 Income Tracker you move from a casual observer to a data-driven investor.
Stop guessing how your portfolio is performing. Export your CSV today, upload it to our tool, and start seeing the true power of your money at work.